Making Bubble Maps with Folium
Jun. 30, 2021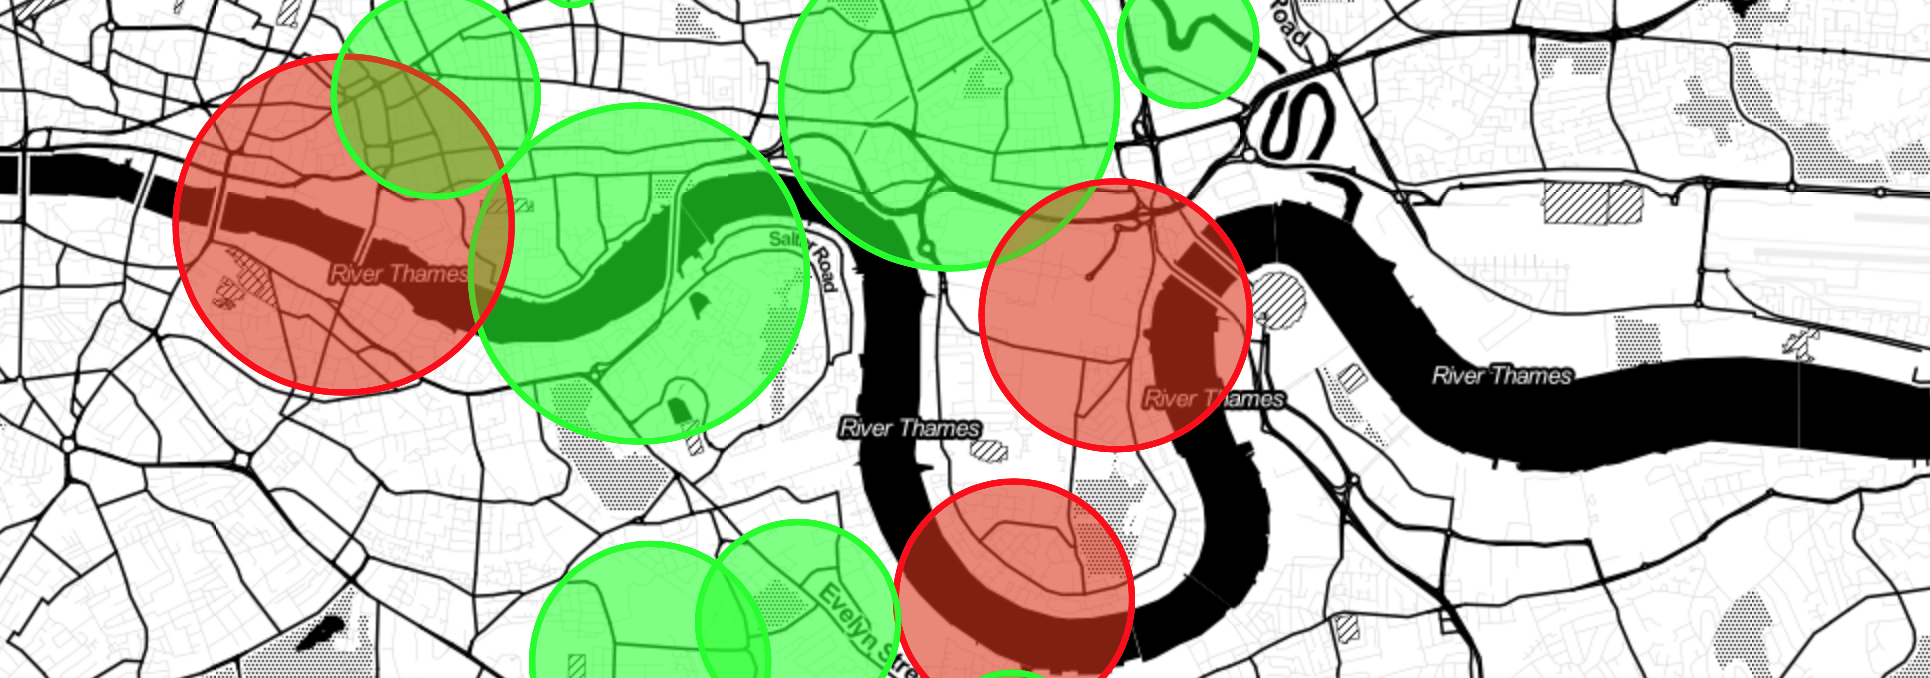
This post details how to make interactive bubble maps in Python with Folium. But before we jump into using Folium, lets generate some fake data with random geographic locations.
import pandas as pd

import random
import sys
import math

# A long and lat point around which the random data will be generated
# In this case a point in central London.

latitude = 51.45
longitude = -0.10

# A function which will generate a random dataset around our long and lat

def random_data(nlat, nlong, nrows, nrange):
    df = pd.DataFrame()
    for row in range(0,nrows):

        # The first line creates a random variable of how large our bubbles will be
        # The second and third create a random 'jitter' around our long/lat
        # The fouth line assigns each row to a binary category

        out = pd.DataFrame([float(random.randint(1, nrange)),
                            nlat + random.random()/10,
                            nlong + random.random()/10,
                            random.randint(1,2)]).T

        df = pd.concat([df,out])

    df.columns = ['Size', 'Lat', 'Long', 'Group']

    return df

# Generating random data

df = random_data(latitude, longitude, 20, 10)
Now that we have our random data we can start mapping it out. Folium is an excellent library for this task. It is a python front end for Leaflet.js which is the backend which powers a good deal of all the interactive maps you see on the web.
We can initialze our map with only a few lines of code
import folium

m = folium.Map(location=[longitude, latitude], tiles="Stamen Toner", zoom_start=12)

m.save('test.html')
You can see this map, without any content, here
To add our we need to create a layer and then loop through our data adding one bubble at a time.
m = folium.Map(location=[latitude, longitude], tiles="Stamen Toner", zoom_start=12)

# Creating the layer which our data will be added to

data_group = folium.FeatureGroup(name='Data')

# looping through our data frame adding each bubble one line at a time

for i in range(0, len(df)):

    data_group.add_child(folium.Circle(
        location=[df.iloc[i]['Lat'], df.iloc[i]['Long']],
        radius = df.iloc[i]['Size'] * 100,
        color='#00FF00',
        popup= 'Value: ' + str(df.iloc[i]['Size']),
        fill=True,
        weight=3,
        opacity=1,
        fillopacity=0.9,
        fill_color='#00FF00'
        ))

# Adding the our data_group layer to the map

m.add_child(data_group)

m.save('test_2.html')
The resulting map looks like this. As the code shows, there are a number of options here we can use to customize the look of the bubbles, including their color, opacity, size (linked to ‘Size’ variable in our data), and popup text which you can directly pass html code to.
This map is slightly off-center as the coordinates we supplied to Folium do not line up with the middle of our randomly generated data. This can quickly be fixed by finding the center of our synthetic data.
from shapely.geometry import MultiPoint

points = list(zip(df['Lat'],
                  df['Long']))

centerpoint = MultiPoint(points).representative_point()
c_lat = centerpoint.x
c_long = centerpoint.y
We can plot our data to different layers by selecting by the binary variable. For example:
m = folium.Map(location=[c_lat, c_long], tiles="Stamen Toner", zoom_start=12)

df1 = df[df['Group'] == 1]
df2 = df[df['Group'] == 2]

data_group_1 = folium.FeatureGroup(name='Data 1')
data_group_2 = folium.FeatureGroup(name='Data 2')

for i in range(0, len(df1)):

    data_group_1.add_child(folium.Circle(
        location=[df1.iloc[i]['Lat'], df1.iloc[i]['Long']],
        radius = df1.iloc[i]['Size'] * 100,
        color='#00FF00',
        popup= 'Value: ' + str(df1.iloc[i]['Size'])  + '\n Group: ' + str(df1.iloc[i]['Group']),
        fill=True,
        weight=3,
        opacity=1,
        fillopacity=0.9,
        fill_color='#00FF00'
        ))

for i in range(0, len(df2)):

    data_group_2.add_child(folium.Circle(
        location=[df2.iloc[i]['Lat'], df2.iloc[i]['Long']],
        radius = df2.iloc[i]['Size'] * 100,
        color='#FF0000',
        popup= 'Value: ' + str(df2.iloc[i]['Size']) + '\n Group: ' + str(df2.iloc[i]['Group']),
        fill=True,
        weight=3,
        opacity=1,
        fillopacity=0.9,
        fill_color='#FF0000'
        ))

m.add_child(data_group_1)

m.add_child(data_group_2)

m.add_child(folium.LayerControl())

m.save('test_3.html')
As you can see from the output map it is possible to switch between the two groups from the button in the top left hand corner of the map. However, one of the issues with this map is that where the bubbles overlap its not possible to select the bubbles from the bottom group.
To address this issue we can add the bubbles sequentially to the same layer.
m = folium.Map(location=[c_lat, c_long], tiles="Stamen Toner", zoom_start=12)

# The crucual step of sorting the data before plotting
# This means that the largest values are plotted first and
# thefore it should always be possiable to select each bubble

df = df.sort_values('Size', ascending=False)

for i in range(0, len(df)):

    if df.iloc[i]['Group'] > 1:
        data_group.add_child(folium.Circle(
            location=[df.iloc[i]['Lat'], df.iloc[i]['Long']],
            radius = df.iloc[i]['Size'] * 100,
            color='#00FF00',
            popup= 'Value: ' + str(df.iloc[i]['Size']) + '\n Group: ' + str(df.iloc[i]['Group']),
            fill=True,
            weight=3,
            opacity=1,
            fillopacity=0.9,
            fill_color='#00ff00'
        ))
    if df.iloc[i]['Group'] == 1:
        data_group.add_child(folium.Circle(
            location=[df.iloc[i]['Lat'], df.iloc[i]['Long']],
            radius = df.iloc[i]['Size'] * 100,
            color='#ff0000',
            popup= 'Value: ' + str(df.iloc[i]['Size']) + '\n Group: ' + str(df.iloc[i]['Group']),
            fill=True,
            weight=3,
            opacity=1,
            fillopacity=0.9,
            fill_color='#ff0000'
        ))


m.add_child(data_group)

m.add_child(folium.LayerControl())

m.save('test_4.html')
Resulting in this final map map.