Making Animations and Videos in R
Mar. 1, 2022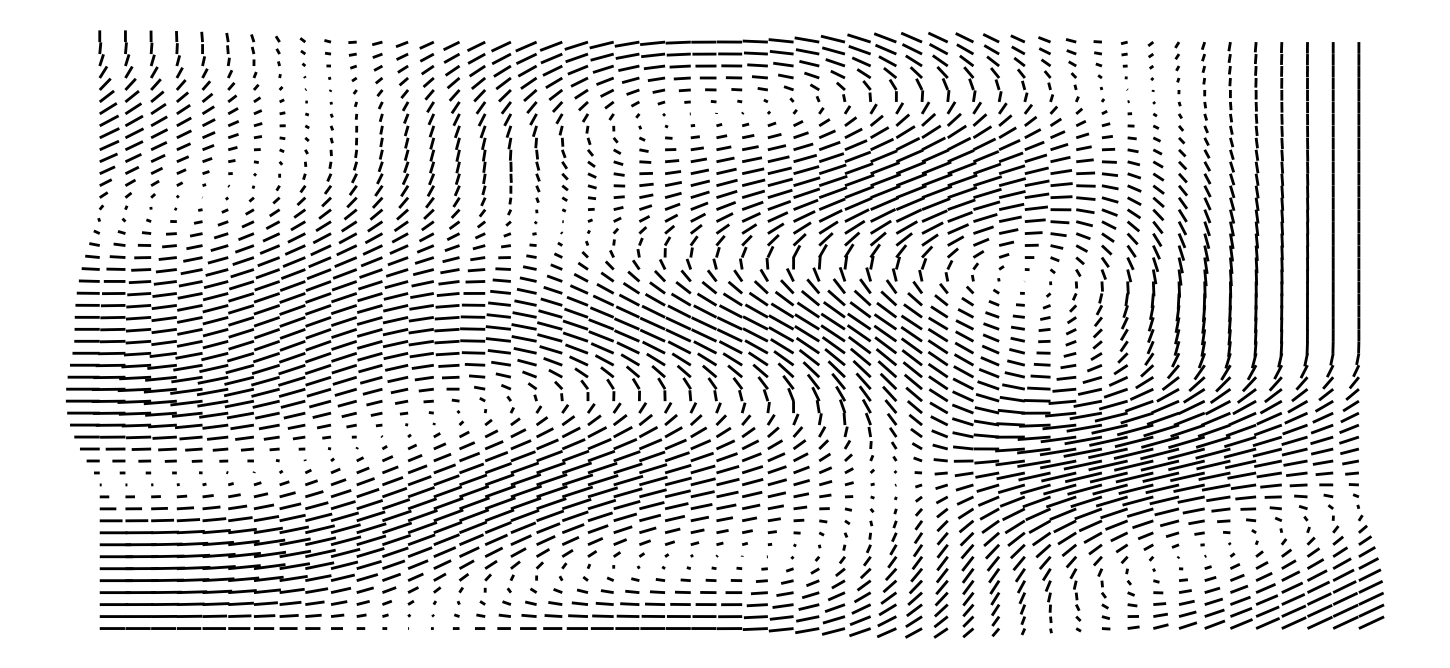
This post details how to make animated graphs in R. For the sake of simplicity (and pretty graphics) I don’t use any real data in this post but instead create some random movement patterns using the ambient library - which is explained in the first section.
For this we will need:
library(ambient)
library(dplyr)
library(ggplot2)
library(data.table)
library(magick) # you may need to install imagemagick separately
library(gapminder) # you may need to install ffmpeg separately
Now lets create some random noise images using the ambient library:
grid <- long_grid(seq(0, 1, l = 50), seq(0, 1, l = 50)) %>% # This creates a 50x50 grid of points
  mutate(curl = curl_noise(gen_perlin, x = x, y = y, # this then contorts the grid
                           frequency = 2, # by the frequency amount based
                           seed = 1)) # on seed random noise

# this bit of code is not ideal but makes it easier to pass to ggplot
grid <- as.data.table(grid) # By converting back and forth between a DT and tibble
grid <- as_tibble(grid) # We reset the curl variables to full columns in their own right

# then we can plot the data using ggplot

p <- ggplot(grid, aes(x, y)) + # Select the data and set the variables to plot
  geom_segment(aes(xend = x + curl.x / 100 , yend =  y + curl.y / 100), # the /100 specifies how long we want to lines to be
               arrow = NULL) +
  theme_void() # this will look much better without x and y axis!
This code will create an image that should look like this:

Now we can put this code into a loop to produce a series of graphs and files where the image changes.
path <- getwd() # Set the directory to save the files too

for(freq_n in seq(1, 2, by=0.1){
  grid <- long_grid(seq(0, 1, l = 50), seq(0, 1, l = 50)) %>%
    mutate(curl = curl_noise(gen_perlin, x = x, y = y,
                             frequency = freq_n,
                             seed = 1))

  grid <- as.data.table(grid)
  grid <- as_tibble(grid)

  ggplot(grid, aes(x, y)) +
    geom_segment(aes(xend = x + curl.x / 100 , yend =  y + curl.y / 100),
                 arrow = NULL) +
    theme_void()

  ggsave(paste0(path, "/image_", freq_n, ".png"))
}
This will then produce five files which we can join together into a a gif using imagemagick.
path_list <- c(paste0(path, "/image_1.1.png"),
          paste0(path, "/image_1.2.png"),
          paste0(path, "/image_1.3.png"),
          paste0(path, "/image_1.4.png"),
          paste0(path, "/image_1.5.png"),
          paste0(path, "/image_1.6.png"),
          paste0(path, "/image_1.7.png"),
          paste0(path, "/image_1.8.png"),
          paste0(path, "/image_1.9.png"))

# read the images from the path_list
img_list <- lapply(path_list, image_read)
# join them all together
img_joined <- image_join(img_list)
# animate them
img_animated <- image_animate(img_joined, fps = 20)
# save it
image_write(image = img_animated,
            path = paste0(path,"/Animated.gif"))
This will produce a simple gif from the list of images that looks like this.

However, using imagemagick becomes problematic when you have lots of images to combine together. As this method creates lots of uncompressed images which then need to be joined together and imagemagick is very inefficient when working with lots of images at once.
Instead we can stream images directly to ffmpeg using the gapminder library which means we can produce lots of images for smooth movement in the final video.
# To use gap minder, we need to pass the prudction of our graphs as a function
video_loop <- function(){

    # By going backwards and forlward in our sequnce we get a nice loop
    sequence <- c(seq(0.1, 2, by=0.01), rev(seq(0.1, 2, by=0.01)))

    for(freq_n in sequence){
      grid <- long_grid(seq(0, 1, l = 50), seq(0, 1, l = 50)) %>%
        mutate(curl = curl_noise(gen_perlin, x = x, y = y,
                                 frequency = freq_n,
                                 seed = 1))

      grid <- as.data.table(grid)
      grid <- as_tibble(grid)

      p <- ggplot(grid, aes(x, y)) +
        geom_segment(aes(xend = x + curl.x / 100 , yend =  y + curl.y / 100),
                     arrow = NULL) +
        theme_void()

      print(p) # gapminder captures each printed output as a frame

    }
  }

video_file <- file.path(path, 'output.mp4')

av::av_capture_graphics(video_loop(), video_file, 720, 720,
                        res = 144,
                        framerate=30)
Which gives us a nice animated video!
